

Story Board Designer
Before you can consume a story board, it needs to be built or designed. The design is meant to be both aesthetic as well as data driven.
To being designing a new story board, choose the red "New Story Board" button on the Start page and then choose a theme and template. You'll be launched into the designer.
Designer Interface
Once inside the Story Board design interface, the user is presented with several panels.
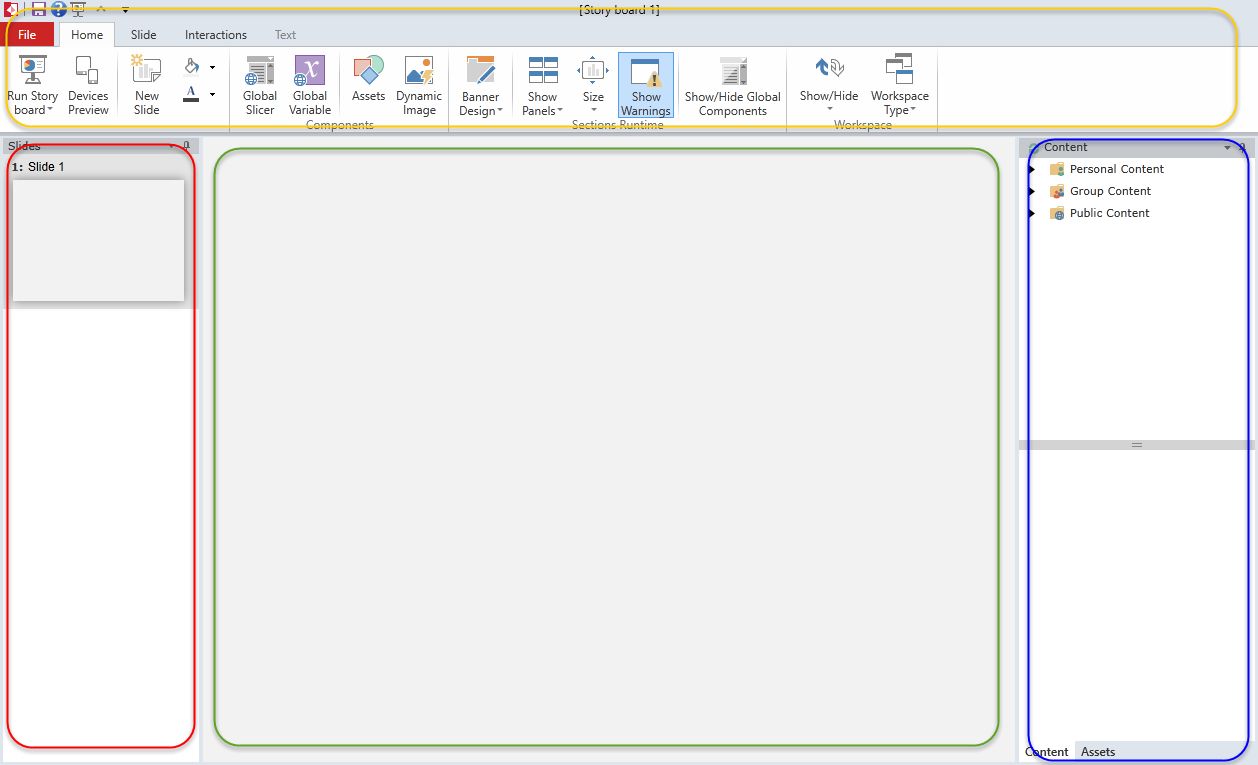
Story Board Ribbon Panel (orange)
All of the application's commands are presented through the ribbon at the top of the workspace. Each tab of the ribbon provides access to the different functions of the application. This is described in detail here.
Slide Tree Panel (red)
This panel, usually on the far left of the screen, shows a listing of all the slides contained within the current dashboard. When users login initially, this panel is exposed. Clicking on a slide will load it up in the slide canvas. This is described in detail here.
Slide Canvas (green)
This panel is the main panel of the application presenting the design interface of the slide to the end user. The slide canvas has numerous layout and formatting options that can be controlled from the Ribbon. The slide canvas is described in detail here.
Content and Asset Trees (blue)
These panels provide users with access to queries built in Data Discovery ("content") and imported objects that can be placed into the slide canvas ("assets"). The content tree is described in detail here. The asset tree is described detail here.
Home |
Table of Contents |
Index |
User Community
Pyramid Analytics © 2011-2022